System monitor
Overview
This addon monitors edge resources usage.
How it works
The addon can monitor up to four families of resources:
- network
- disk
- CPU
- RAM
The list of metrics gathered from each one of those can be fully customized from Connhex Control and can be differentiated on a per-device basis.
A typical configuration for this addon would gather every possible metric on test and pre-series devices, whereas only aggregated metrics would be collected on devices deployed on the field to save on data transfer rates. Another common use case involves defining a group of devices on the field that will be the first ones to get firmware updates: those should be monitored in detail.
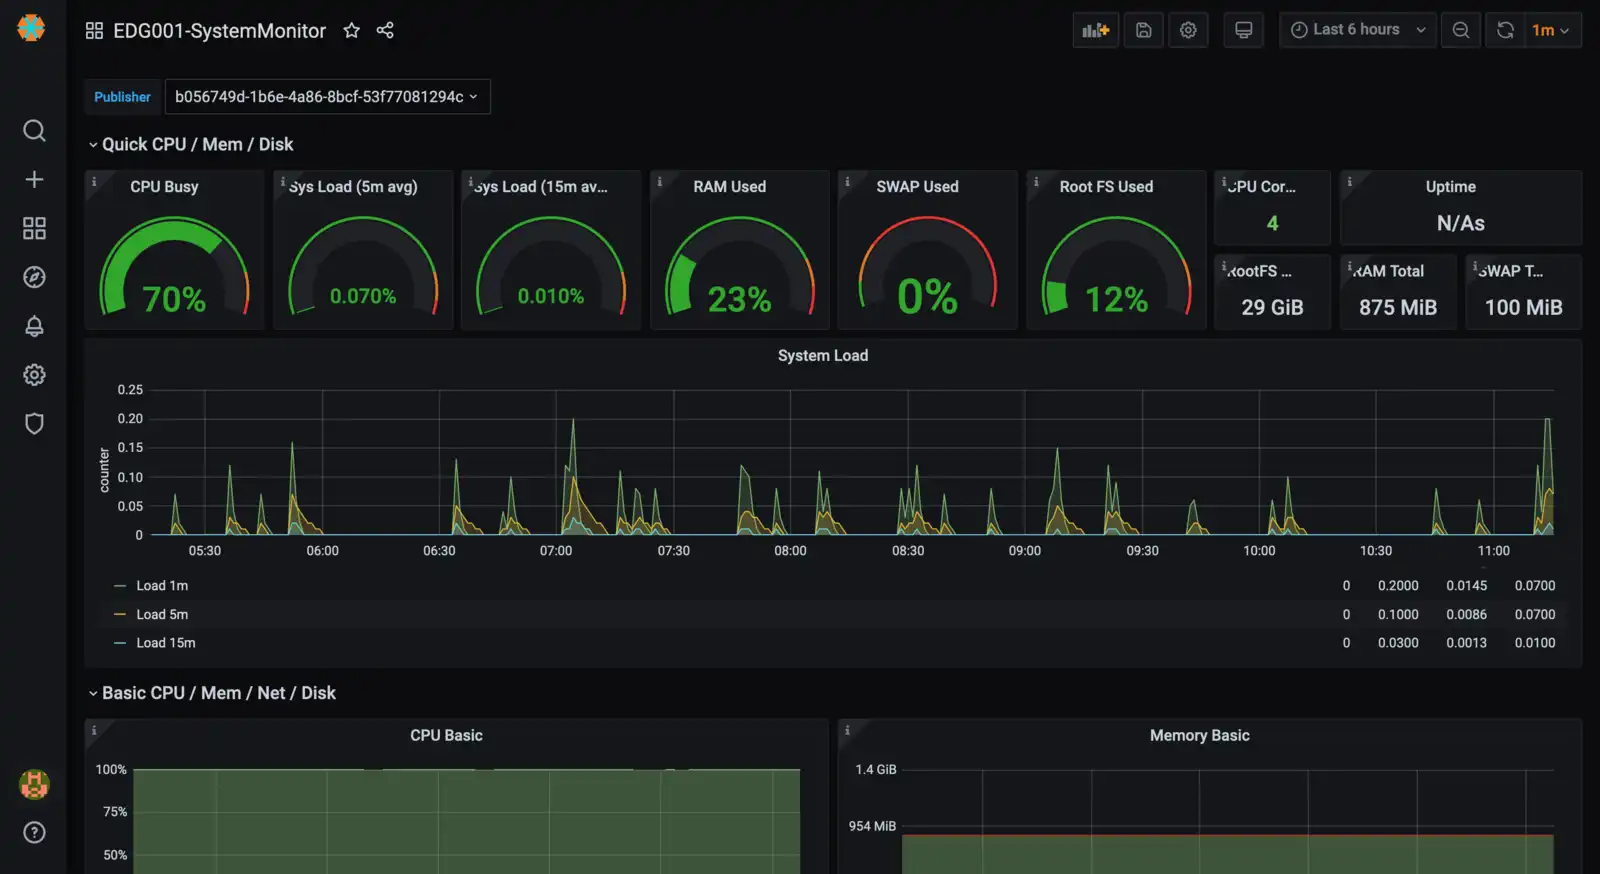
Once the addon is started on the device, it will periodically send the collected metrics to your Connhex instance. Thanks to the integration inside Connhex of the state of the art observability platform, Grafana, you will get a complete monitoring dashboard straight out of the box together with customizable alerts.
Requirements
- Connhex Edge: >=
v1.1.0 - For supported architectures and minimum hardware requirements, see here.