ConnhexMonitoring
A complete kit for infrastructure monitoring.
Real-time data visualization
Custom alerts and notification policies
Streamlined insights
services
Resource monitoring
Connhex Monitoring provides clear and meaningful insights into the resource usage of each Connhex service. You can monitor different metrics such as:
- CPU
- I/O
- Network usage
- RAM
databases
Databases analysis
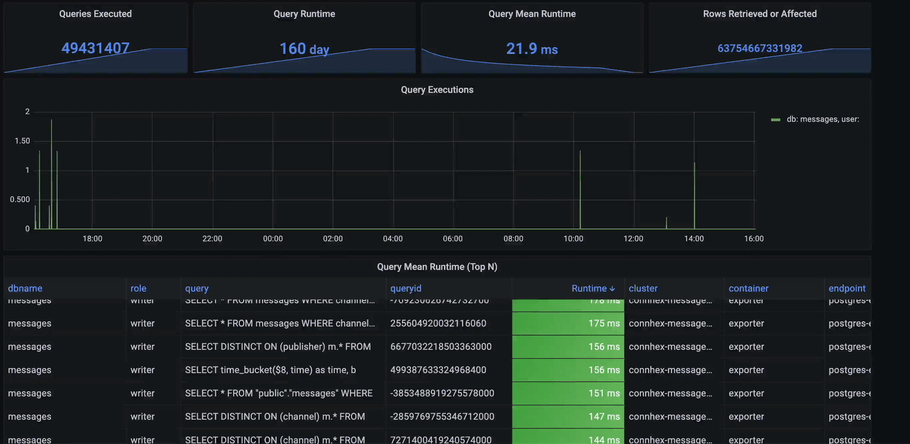
Gain in-depth visibility into your databases. For example, you can analyze uptime, system statistics, number of connections, transaction counts, query history, cache efficiency (including the cache hit ratio), and identify slow-performing queries.
devices
Device insights
Get information about device connections and messages: monitor active connections, sent/received message counts, connection traffic, message queues, identify slow-performing clients, and detect connection errors.
alerts
Get alerted on unexpected events
Set custom alarms on unexpected events. Get notified whether a service is unavailable or running out of resources, when your volumes have low disk space, etc.